
Performance monitor
A live CPU / Memory / Network / Processes dashboard, updated once a second. Everything stays on your machine.
Orbittest Client v1.2.0 (2026-06-26) turns the app into something you can watch as well as work in. A brand-new Performance monitor gives you a live, Task-Manager-style view of CPU, memory, network latency, and processes — without a single byte leaving your machine. Pulsar monitors are now fully manageable from one menu, the workspace gets a cleaner icon-only activity bar, and every chart finally tells you when. And because it rolls up everything shipped since v1.0.1, upgrading lands Beacon, Source Control, and more in one step.
Performance monitor
A live CPU / Memory / Network / Processes dashboard, updated once a second. Everything stays on your machine.
Pulsar monitor management
A per-monitor ⋮ menu — Edit, Pause/Enable, and Delete — with confirm-on-delete.
Icon-only activity bar
A cleaner left rail; hover any icon to reveal its name.
Date/time chart axes
Pulsar, Beacon, and Performance time-series charts now label the time axis.
Open the Performance icon in the left rail for a live, read-only diagnostics dashboard that updates once a second. It works like Windows Task Manager, but scoped to Orbittest Client — and nothing leaves your machine.
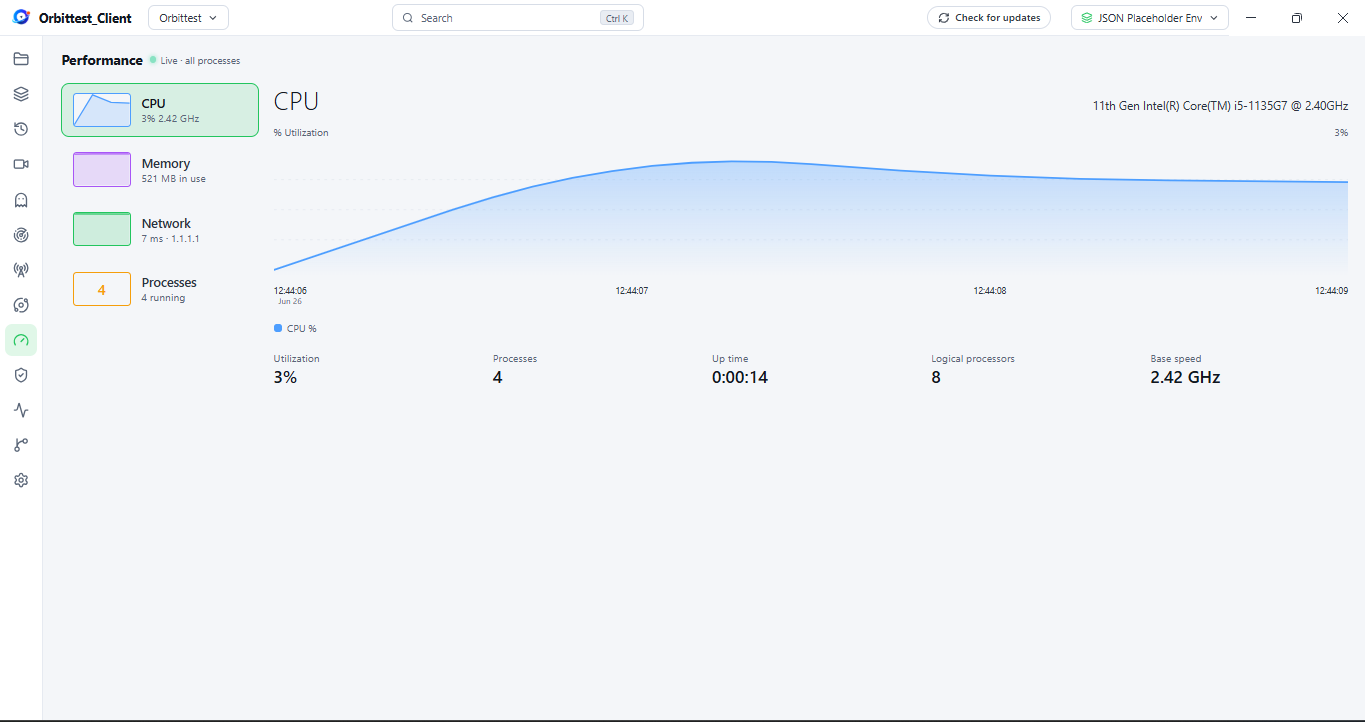
A category rail on the left switches between four live views.
The app’s combined processor usage over time, alongside host details: CPU model, number of logical processors, base clock speed, and how long the app has been running (uptime).
The app’s memory footprint over time, shown next to your system’s total and available memory.
Measures the round-trip time from your computer to a server — how long a message takes to get there and back. Lower is better.
Pick a server with the one-click Cloudflare or Google presets, or type your own (for example api.example.com or 1.1.1.1).
Read the rating badge, which grades the connection in plain English:
| Rating | Round-trip time |
|---|---|
| Excellent | < 80 ms |
| Good | < 150 ms |
| Fair | < 300 ms |
| Poor | ≥ 300 ms |
| Offline | server doesn’t respond |
Track the connection over time with Average, Best, and Worst, plus the percentage of dropped checks — great for spotting a flaky link.
A live list of every process the app runs — name, PID, CPU %, and memory — sorted by memory use.
Pulsar runs your scheduled monitors while Orbittest Client is open. In v1.2.0, every monitor gains a ⋮ menu so you can manage it without leaving the list.
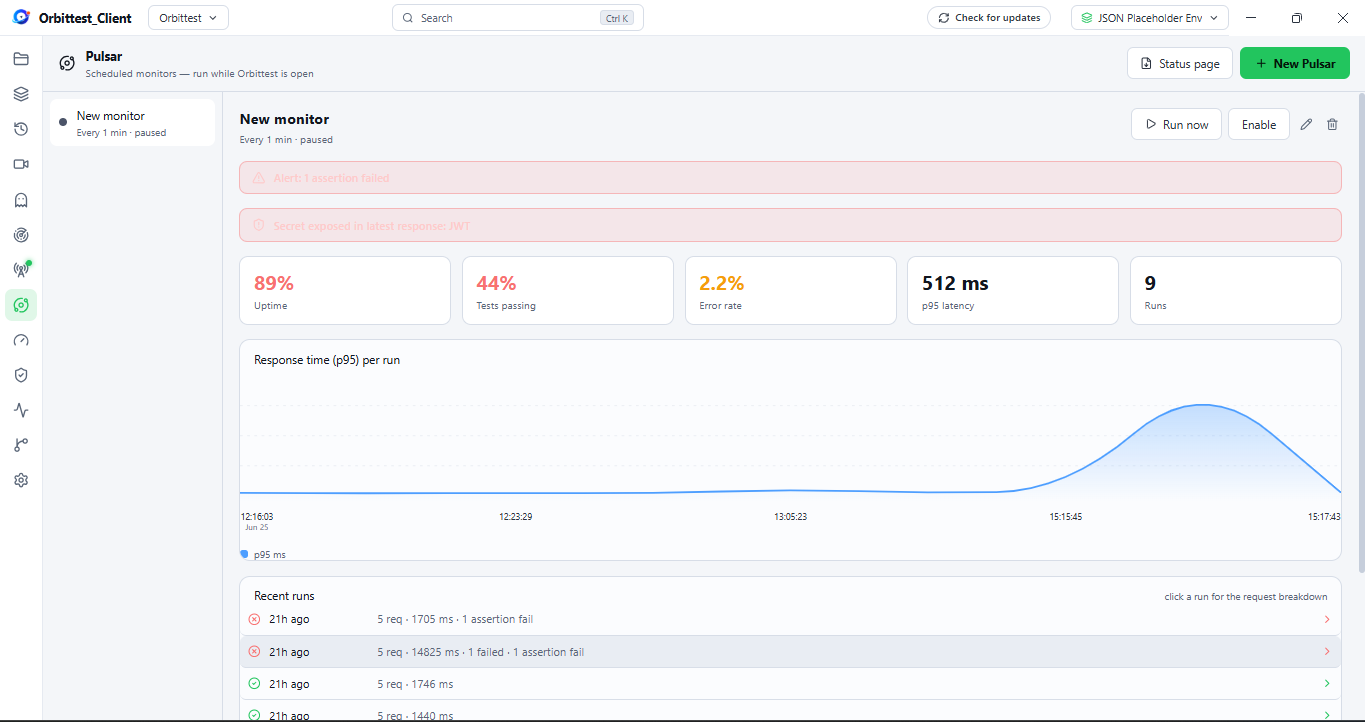
New monitors are now created with the name “New Pulsar.”
The v1.2.0 installer rolls up every feature shipped after v1.0.1. If you’re upgrading from v1.0.1, you also get the following.
Beacon
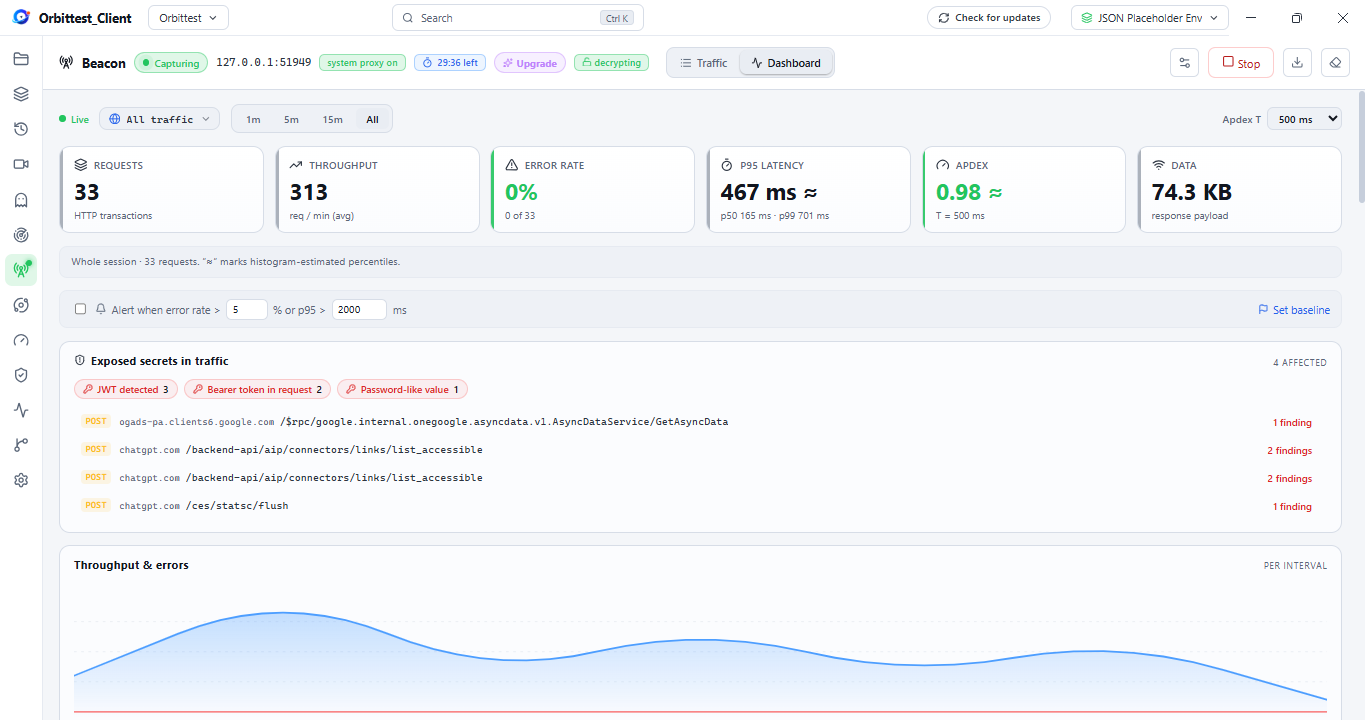
A live HTTP proxy that captures and decrypts traffic, with a Traffic view and a metrics Dashboard (throughput, error rate, p95 latency, Apdex) — and it flags exposed secrets such as JWTs and bearer tokens.
Pulsar
Scheduled monitors that run while Orbittest Client is open, tracking uptime, error rate, and p95 latency over time, with a shareable status page.
Source Control
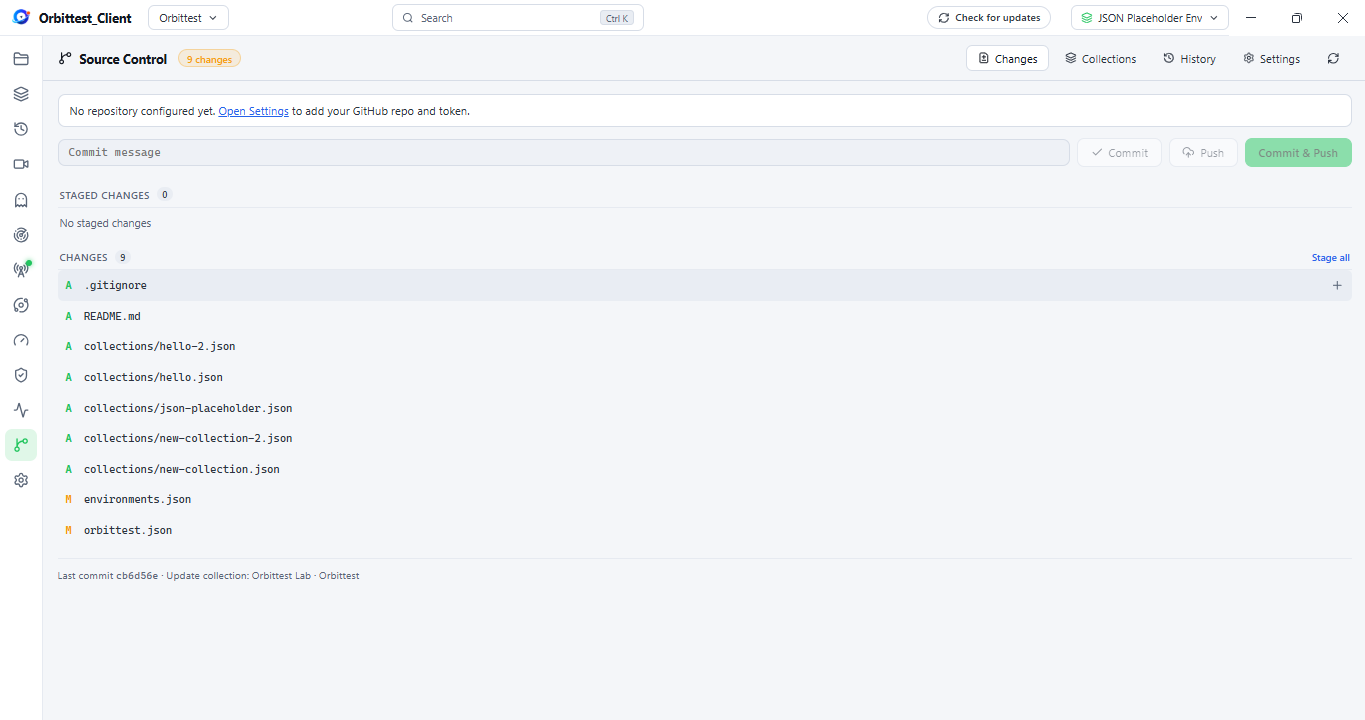
Stage, commit, and push your collections and environments to a GitHub repo, with a history and per-file diff view.
Multi-source import
Bring in requests from cURL, Postman, and other sources.
Secret & dynamic variables
Mask sensitive values and generate values at send time.
Beacon proxies your HTTP traffic so you can watch every request live, then switch to a metrics Dashboard to see throughput, error rate, p95 latency, and Apdex for the whole session. It also scans payloads and headers for exposed secrets — JWTs, bearer tokens, and password-like values — and lists exactly where each finding occurred.
Commit your collections and environments to a GitHub repository straight from the app. Stage changes, write a commit message, and Commit & Push in one place, with a full history and per-file diffs.
Orbittest Client updates automatically in the background, so most users are already on v1.2.0. To install or reinstall manually, download the signed Windows installer from the release page.
Orbittest Client v1.0.1 (2026-06-17) brought four new capabilities to the local-first API testing workstation: OAuth 2.0 authentication, a real code editor for scripts and bodies, live variable autocomplete, and a command-line runner for CI pipelines.
OAuth 2.0 authentication
Request, store, and attach access tokens from the auth editor — no more hand-pasted bearer tokens.
Syntax-highlighted editor
JavaScript highlighting for pre-request scripts, test scripts, and request bodies.
Variable autocomplete
Live {{variable}} scanning with inline autocomplete across the request builder.
Command-line runner
Run collections from the terminal with JSON / JUnit output — built for CI.
Until now, calling a protected API meant generating a token somewhere else and pasting it into a header by hand — then doing it again every time the token expired. In v1.0.1, Orbittest Client can request, store, and attach OAuth 2.0 access tokens for you, directly from the request’s Auth tab.
Open a request and select the Auth tab.
Choose OAuth 2.0 as the authorization type.
Fill in the token details for your provider — typically the token endpoint URL, client ID, client secret, scope, and the grant type (for example Authorization Code or Client Credentials). Any field accepts {{variables}}, so you can keep secrets in an environment instead of the request.
Click Request Token. Orbittest Client performs the token exchange and stores the resulting access token with the request.
Send the request. The stored token is attached automatically as an Authorization: Bearer … header — you never copy or paste it.
Scripts and bodies open in a real code editor with JavaScript syntax highlighting instead of a plain text box. Highlighting applies in three places:
This makes it far easier to spot a missing bracket, an unterminated string, or a typo before you run anything.
// Compute a timestamp and stash it for the request to use.const now = Date.now();ot.variables.set('requestedAt', String(now));// Assert on the response after it arrives.ot.test('status is 200', () => { ot.expect(ot.response.status).toBe(200);});
ot.test('body has an id', () => { const body = ot.response.json(); ot.expect(body.id).toBeDefined();});Orbittest Client scans your variables live — from the active environment, the collection, and any data-driven row — and offers inline autocomplete as you type. Start typing {{ in almost any field and a dropdown of matching variable names appears; pick one and it’s inserted complete.
Autocomplete is available across the request builder, including:
GET {{baseUrl}}/users/{{userId}}Authorization: Bearer {{accessToken}}This removes the two most common variable bugs: misremembering a name, and referencing a variable that doesn’t exist in the current scope.
A CLI runs your saved collections and requests straight from the terminal — no UI required. It’s scriptable, returns proper exit codes, and emits JSON and JUnit reports, which makes it a natural fit for CI pipelines.
orbittest-client run "My Collection" --env staging| Option | What it does |
|---|---|
--env <name> | Run with a named environment’s variables. |
--data <file> | Drive the run from a CSV / JSON data file (one iteration per row). |
--reporter <list> | Output format(s): json, junit, or both (comma-separated). |
--out <dir> | Directory to write report files into. |
--bail | Stop on the first failing request. |
orbittest-client run "My Collection" \ --env ci \ --reporter json,junit \ --out ./reportsThe JUnit report drops straight into most CI test dashboards, and the JSON report carries full request/response detail for custom processing. The runner exits with code 0 when every request and test passes and a non-zero code otherwise, so a failing run fails the build.
name: API testson: [push]jobs: api-tests: runs-on: windows-latest steps: - uses: actions/checkout@v4 - name: Run Orbittest Client collection run: orbittest-client run "My Collection" --env ci --reporter junit --out reports - name: Publish results if: always() uses: actions/upload-artifact@v4 with: name: api-test-reports path: reports