Your API test suite is green. Everything passed. Then, three days later, a user complains the app feels slow, or a teammate pastes a screenshot of an error nobody’s seen before — and you have no real way to answer “what actually happened?” because nothing was watching when it happened.
That gap is exactly what two Orbittest Client features are built to close. Beacon shows you your API traffic live, as it happens, and flags anything that looks like a leaked secret. Pulsar keeps checking one request over and over on a schedule, so you know if it’s still healthy without opening anything by hand. Neither needs an account, a cloud dashboard, or a monthly bill to get started — both run inside the same free, local-first desktop app.
This guide explains what each one actually does, in plain language, with real screenshots from the app.
Table of Contents
- What is Beacon?
- What Beacon’s dashboard actually shows you
- Beacon also catches secrets you didn’t mean to send
- What is Pulsar?
- What a Pulsar monitor tracks
- One thing to know before you rely on Pulsar
- Beacon vs Pulsar: two different jobs
- How to turn each one on
- Are Beacon and Pulsar free?
- Frequently asked questions
- Key takeaways
- Conclusion
What is Beacon?
Beacon is a live traffic proxy. In plain words: you turn it on, and it sits between your app (or your browser, or anything else on your machine) and the internet, so it can see every request going out and every response coming back. Reading plain HTTP traffic works right away. Reading inside HTTPS traffic is a separate, opt-in step — more on that below.
Most people reach for something like this when a bug report says “it’s slow” or “it broke” and nobody has details. Instead of guessing, you turn on Beacon, reproduce the problem once, and look at exactly what was sent and received.
What Beacon’s dashboard actually shows you
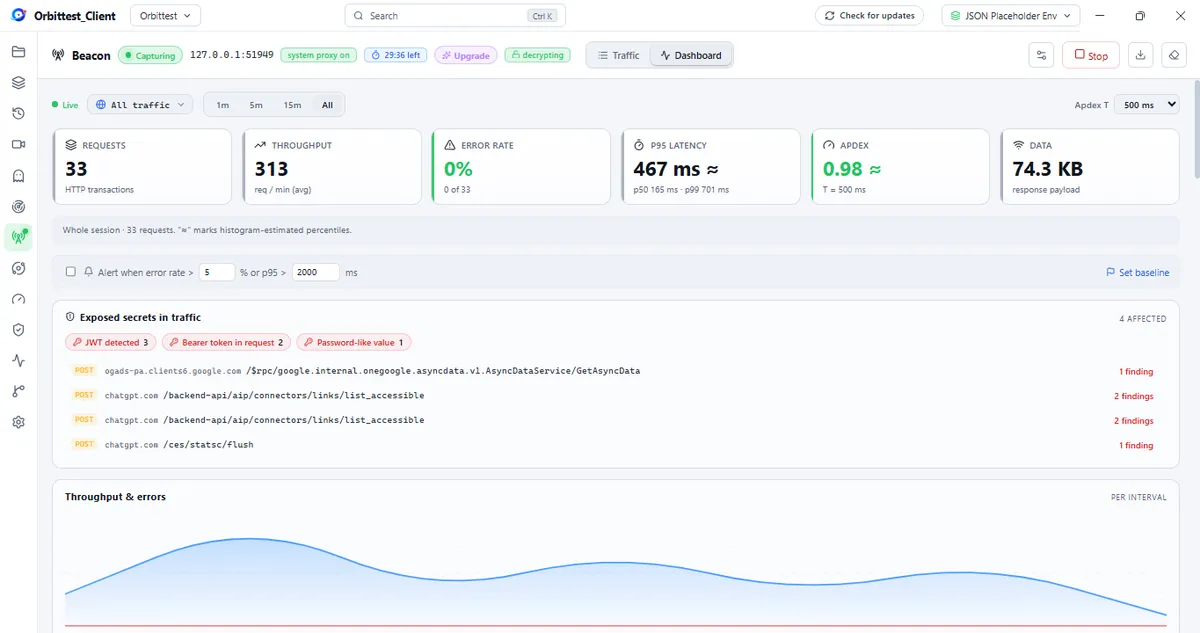
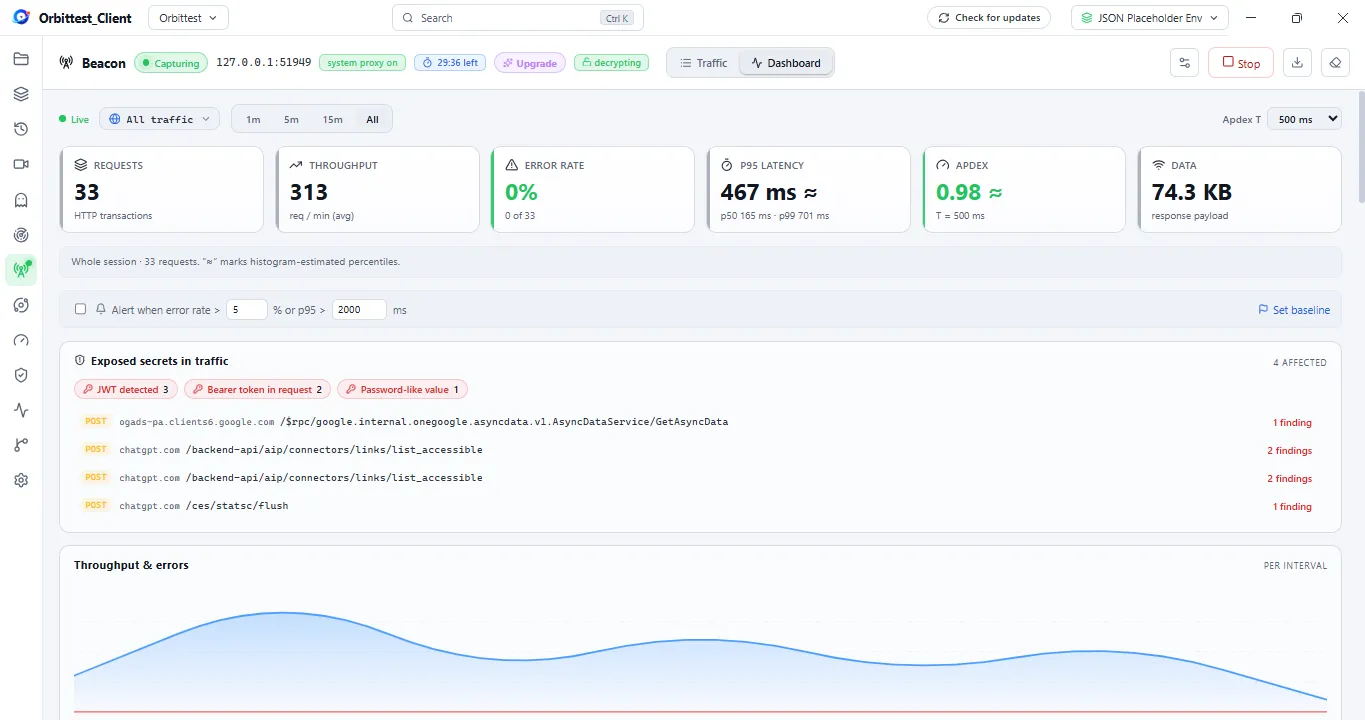
Beacon has two views: a Traffic view, which lists every request one by one as it happens, and a Dashboard view, which rolls everything up into numbers. The Dashboard shows six things, and here’s what each one means in plain terms:
- Requests — how many HTTP calls happened in the time window you’re looking at.
- Throughput — how many requests per minute were happening, on average.
- Error rate — what percentage of those requests came back as a failure.
- p95 latency — this sounds technical, but it just means: out of every 100 requests, 95 of them finished faster than this number. It’s a better read on real-world speed than an average, because one extremely slow request can’t quietly drag an average down while everything else looks fine.
- Apdex — a single score between 0 and 1 that answers “did this feel fast today?” You set a target speed (Beacon defaults to 500 ms), and Apdex rolls every request into one number based on how many were fast, borderline, or slow against that target. 1.0 means everything felt fast; closer to 0 means it didn’t.
- Data — the total size of everything that moved through, in and out.
Underneath the numbers is a chart of throughput and errors over time, so a spike is easy to spot instead of buried in a log file.
Beacon also catches secrets you didn’t mean to send
This is the part most traffic tools don’t bother with. While Beacon is capturing your traffic, it also scans every request and response for things that look like secrets — a JWT, a bearer token, a password-like value — and lists exactly which request each one showed up in.
It’s easy to accidentally log a token, echo one back in a response, or leave one sitting in a URL during testing. Catching it while you’re debugging, on your own machine, is a lot cheaper than catching it after that traffic capture gets shared with a teammate or pasted into a ticket.
What is Pulsar?
Beacon answers “what’s happening right now?” Pulsar answers a different question: “is this still working?”
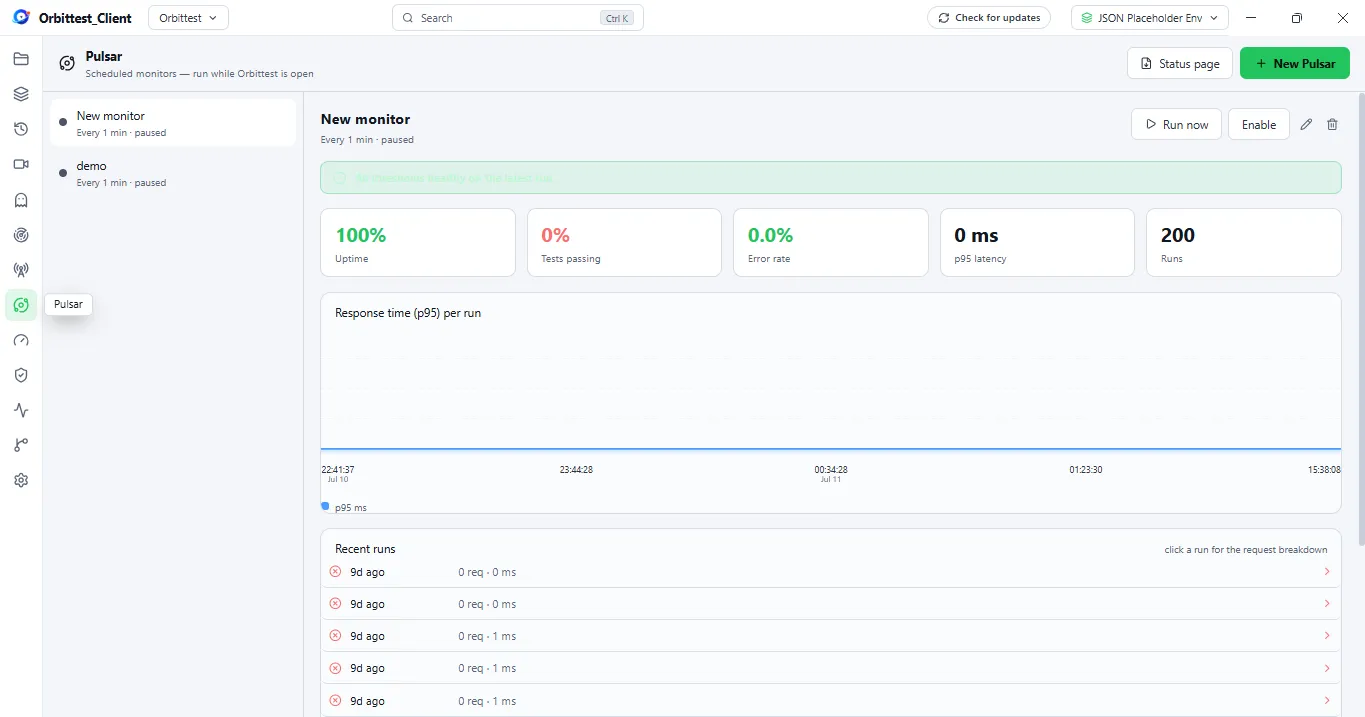
Pulsar is a scheduled monitor. You give it one request — a login call, a health-check endpoint, a key part of your API — and a schedule, like every minute. From then on, Pulsar keeps sending that exact request on that timer, and keeps a history of what happened each time.
What a Pulsar monitor tracks
Each monitor shows five numbers at a glance:
- Uptime — the percentage of scheduled runs that came back successfully.
- Tests passing — if you’ve attached assertions (checks like “status should be 200”), this shows how many of those checks are still passing, not just whether the server replied at all.
- Error rate — how often a run failed outright.
- p95 latency — the same “95 out of 100 were faster than this” number Beacon uses, but tracked run over run instead of request over request.
- Runs — how many times the monitor has fired so far.
Below that sits a response-time chart plotted over time, and a list of recent runs you can click into for the full request and response from that specific check. If a run fails an assertion, or a secret turns up in a monitored response, Pulsar flags it right there instead of making you dig through history to notice.
Every monitor also has its own Status page — a simple, shareable view of whether that endpoint is currently healthy, so a teammate can check without opening Orbittest Client themselves. And each monitor comes with a small menu to edit its request or schedule, pause it without deleting it, or delete it outright.
One thing to know before you rely on Pulsar
Here’s the honest part: Pulsar runs while Orbittest Client is open. It is not a separate server running in the cloud that keeps checking your API after you shut your laptop. That’s a direct consequence of Orbittest Client being local-first — there’s no account and no server doing the work on your behalf, which is exactly why nothing about your API ever leaves your machine.
For a lot of real use — “keep an eye on this staging endpoint while I’m working,” or “let this run overnight on a machine I leave on” — that’s exactly the right trade-off. But if you need a truly 24/7, always-on alert for something business-critical, that’s a job for a dedicated hosted uptime service, not Pulsar. Know which job you’re asking it to do.
Beacon vs Pulsar: two different jobs
| Beacon | Pulsar | |
|---|---|---|
| Answers | ”What is actually happening right now?" | "Is this endpoint still healthy?” |
| Watches | Every request your machine makes | One request you chose |
| Runs | While you turn it on, for a session | On a repeating schedule |
| Shows | Live traffic + a metrics dashboard | Uptime, error rate, and speed over time |
| Also does | Flags leaked secrets in traffic | Flags failed assertions and secrets in monitored responses |
| Best for | Debugging a specific problem right now | Watching one endpoint’s health over days or weeks |
How to turn each one on
For Beacon: open the Beacon icon in the left rail and press Start capturing. Its settings panel is worth a look before you do:
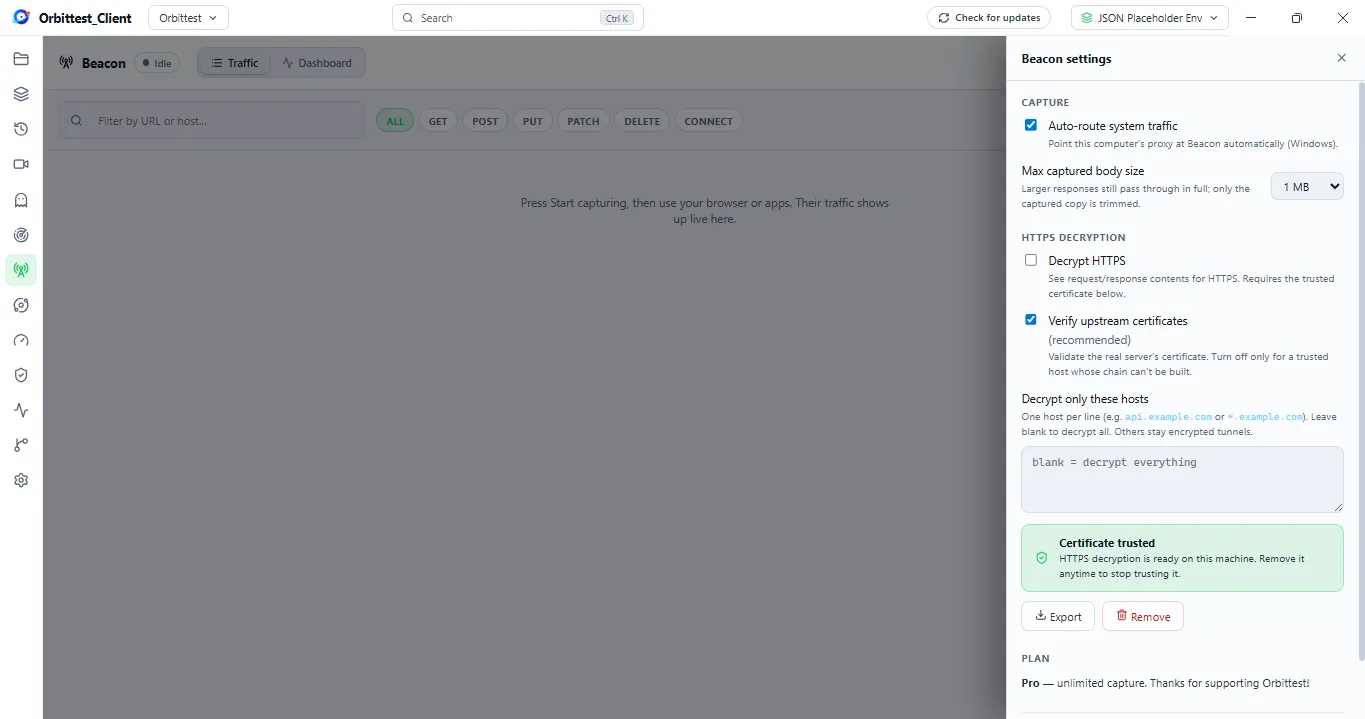
- Auto-route system traffic points your computer’s proxy at Beacon automatically, so you don’t have to configure anything by hand.
- Max captured body size (1 MB by default) caps how much of each request or response body gets stored. Larger payloads still pass through the app normally — only the saved copy gets trimmed.
- Decrypt HTTPS is off by default. Leave it off and Beacon still sees which hosts you’re talking to; turn it on and it also shows you the actual encrypted contents, which requires trusting a local, machine-only certificate — Beacon walks you through that the first time.
- Decrypt only these hosts lets you list specific domains (like
api.example.com) so only those get opened up, while everything else stays as an untouched encrypted tunnel. Leave it blank to decrypt everything.
Once it’s capturing, everything your machine sends and receives starts showing up in the Traffic view, and the Dashboard starts filling in live.
For Pulsar: open the Pulsar icon, click New Pulsar, and give it a request and a schedule (Orbittest Client’s default is every minute). It starts running immediately, and you’ll see its first results appear as soon as the first run completes.
Are Beacon and Pulsar free?
Pulsar’s scheduled monitors are part of the Free tier — no license key needed to try it. Beacon is available on Free too, but as a time-boxed session, which is normally plenty for a single debugging pass. The Pro tier removes that time limit, so Beacon can stay on for as long as you need it.
Frequently asked questions
Q: What is Beacon in Orbittest Client? A live traffic proxy that shows you every request and response your machine makes, plus a metrics dashboard and a scan for leaked secrets like JWTs and tokens. Reading inside HTTPS traffic is a separate setting you turn on when you need it.
Q: What is Pulsar in Orbittest Client? A scheduled monitor: point it at one request, set a schedule, and it keeps checking that endpoint over time, tracking uptime, error rate, and speed, with a shareable status page.
Q: What’s the difference between Beacon and Pulsar? Beacon watches everything happening right now. Pulsar checks one specific thing, again and again, over time. One is for debugging in the moment; the other is for watching health over days.
Q: Does Beacon see my encrypted HTTPS traffic? Only if you turn on its Decrypt HTTPS setting — it’s off by default. Turning it on lets Beacon show the real contents, using a local, machine-only certificate, and you can limit it to specific hosts. Nothing is sent anywhere else either way.
Q: Does Pulsar keep running if I close Orbittest Client? No. Its monitors run while the app is open — it’s not a background cloud service.
Q: Are Beacon and Pulsar free? Pulsar is included in Free. Beacon is time-boxed on Free and unlimited on Pro.
Key takeaways
- Beacon shows you everything happening right now; Pulsar checks one thing, on repeat, over time.
- Reading inside HTTPS traffic is an opt-in setting in Beacon, not the default — you turn it on and trust a local certificate only when you need it.
- p95 latency means “95 out of 100 were faster than this” — it’s a fairer read on speed than an average.
- Apdex is one number, 0 to 1, for “did this feel fast today?”
- Both features scan for leaked secrets — Beacon in live traffic, Pulsar in monitored responses.
- Pulsar runs while the app is open; it’s not a 24/7 hosted uptime service.
- Pulsar is free to use; Beacon is time-boxed on Free and unlimited on Pro.
Conclusion
Most bug reports start with “it’s slow” or “it broke,” and end with someone guessing. Beacon and Pulsar exist so you don’t have to guess — one lets you see exactly what your app sent and received the moment something goes wrong, and the other keeps quietly checking, so you find out an endpoint is unhealthy from a chart instead of from a customer.
Both are already part of Orbittest Client, with nothing to configure beyond turning them on. If you want the complete list of what shipped alongside them, the full release notes cover the Performance monitor, Source Control, and everything else that came in the same set of updates.
Written by Abhay Kumar — QA engineer and creator of OrbitTest, building practical tools for browser, mobile, and API testing. Browse more API testing articles.