For years, API testing tools have been good at one thing: sending a request and showing you the response. You fire a GET, you read the JSON, you write an assertion, you move on. That model works right up until the moment a real problem shows up — and real problems rarely announce themselves while you’re staring at the request builder.
They show up later. A service that was fast on Monday is sluggish on Thursday. A token that should never have been logged turns up in a request body. An endpoint that passed every manual check quietly starts returning 500s at 2 a.m. while everyone’s asleep. None of these are caught by sending one more request by hand.
Orbittest Client v1.2.0 is built around that gap. This release turns the app from a request workbench into something you can watch — a place to monitor API health, latency, traffic, and secrets continuously, not just poke at endpoints one at a time. This guide walks through what changed, the specific problems each feature solves, and how to fold it into a real QA workflow.
Table of Contents
- What’s New in Orbittest Client v1.2.0
- Problem 1: You Can’t See What the App Is Doing
- Problem 2: “Is It the API or My Connection?”
- Problem 3: Nobody Watches the API at 2 a.m.
- Problem 4: Secrets Leak Into Traffic and Nobody Notices
- Problem 5: Your Test Collections Aren’t Version-Controlled
- Smaller Refinements That Add Up
- A Day in the Life with Orbittest Client v1.2.0
- Best Practices
- Common Mistakes
- Frequently Asked Questions
- Conclusion
What’s New in Orbittest Client v1.2.0
At a high level, Orbittest Client v1.2.0 ships four big additions and a handful of refinements:
| Feature | What it does | The problem it solves |
|---|---|---|
| Performance monitor | Live CPU, memory, network latency, and process views | Diagnosing whether the app — or your machine — is the bottleneck |
| Pulsar management | Edit, pause, enable, and delete scheduled monitors | Keeping a fleet of always-on API checks under control |
| Beacon proxy + dashboard | Capture and decrypt HTTP traffic with live metrics | Seeing all traffic, not just the requests you sent by hand |
| Exposed-secret detection | Flags JWTs, bearer tokens, and password-like values in traffic | Catching credential leaks before they ship |
Every one of these runs locally. Orbittest Client has always been a local-first, offline-friendly workspace, and v1.2.0 keeps that promise: the Performance monitor reads only your own machine, and the Beacon proxy decrypts traffic on your device. Nothing is uploaded.
If you’re already running Orbittest Client, you don’t have to do anything — the app checks GitHub Releases and updates itself in the background. New users can download the signed Windows installer and be on v1.2.0 in a minute. The complete, version-by-version list lives in the official release notes.
Let’s go through the new capabilities the way you’d actually hit them: as problems first, then the solution Orbittest Client now offers.
Problem 1: You Can’t See What the App Is Doing
Here’s a scenario every tester recognizes. You’re running a data-driven collection with a few thousand iterations, and halfway through, everything crawls. Is it the API rate-limiting you? Is your laptop thermal-throttling? Is the app itself leaking memory? Without numbers, you’re guessing — and guessing wrong wastes hours.
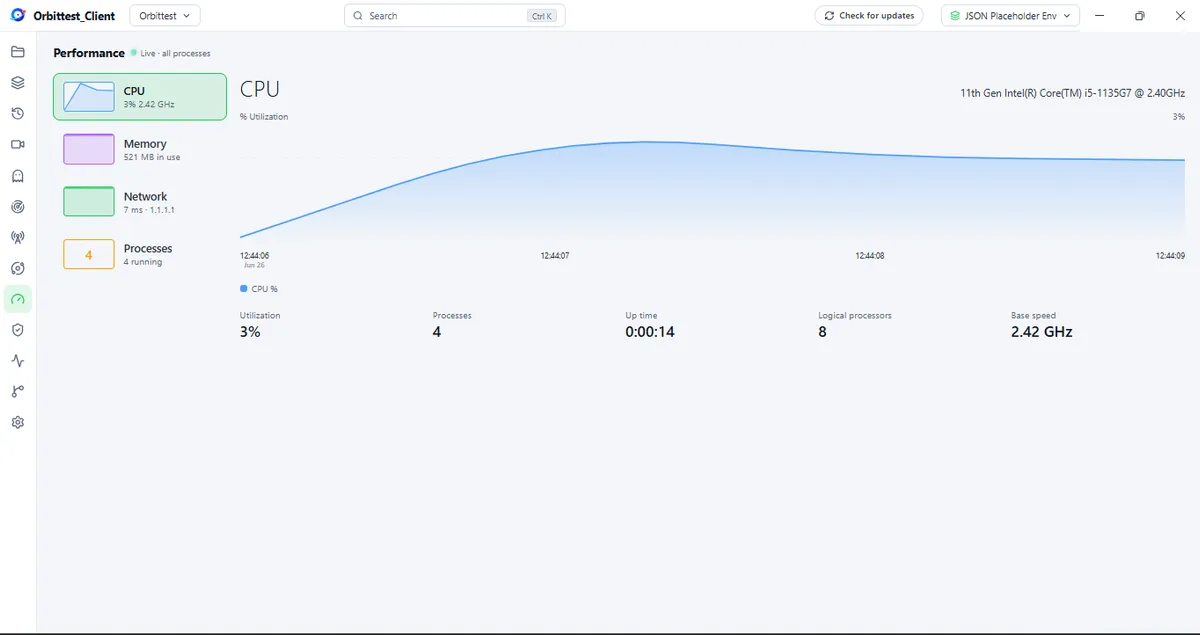
The solution: the Performance monitor. Open the Performance icon in the left rail of Orbittest Client and you get a live, Task-Manager-style dashboard that refreshes once a second. A category rail switches between four views:
- CPU — the app’s processor usage over time, plus host details: your CPU model, the number of logical processors, base clock speed, and how long the app has been running (uptime).
- Memory — the app’s memory footprint over time, next to your system’s total and available memory. If a long run is slowly eating RAM, you’ll see the line climb.
- Network — live connection latency to a server you choose (more on this below).
- Processes — every process the app runs, with name, PID, CPU %, and memory, sorted by memory use.
The Performance monitor is deliberately read-only. It surfaces diagnostics so you can spot a runaway process or a memory climb; it never changes anything on your system. When a run goes sideways, you no longer have to alt-tab to Windows Task Manager and try to guess which process belongs to your API testing tool — Orbittest Client shows you its own numbers, in context.
Problem 2: “Is It the API or My Connection?”
This is the oldest argument in QA. A request is slow. The backend team says the service is fine. You say it’s slow on your end. Nobody has data, so the ticket bounces back and forth for a day.
The solution: the Network view in the Performance monitor. It measures the round-trip time from your computer to a server — how long a message takes to get there and back. Lower is better.
You pick a target with one-click Cloudflare or Google presets, or type your own host (for example api.example.com or 1.1.1.1). Orbittest Client then rates the connection in plain English, so you don’t have to interpret raw milliseconds:
| Rating | Round-trip time |
|---|---|
| Excellent | under 80 ms |
| Good | under 150 ms |
| Fair | under 300 ms |
| Poor | 300 ms or more |
| Offline | server doesn’t respond |
Alongside the rating, you get Average, Best, and Worst times plus the percentage of dropped checks — which is exactly what you need to prove “my connection is flaky” or “the connection is fine, so the slowness is the API.”
One honest note on how this works, because it matters for interpreting the numbers: latency is measured with a TCP connection test, a privilege-free stand-in for the traditional ICMP ping. Because it completes a full connection handshake, the numbers run slightly higher than a raw OS ping — but they track connection health the same way. Throughput (MB/s) is intentionally not included; reading per-interface byte counters needs a native module, so the Network view is a latency monitor, not a bandwidth graph. That’s a deliberate scope choice, and it’s better to know it than to misread the chart.
With this view, the “is it the API or my connection?” debate ends with a screenshot instead of a shrug.
Problem 3: Nobody Watches the API at 2 a.m.
Manual testing has a fundamental blind spot: it only happens when a human is looking. Your staging API can be down for six hours overnight and the first you’ll hear of it is a failed demo the next morning.
The solution: Pulsar. Pulsar is Orbittest Client’s scheduled-monitor engine — it runs your saved requests on a schedule while the app is open, tracking uptime, error rate, and p95 latency over time, with a shareable status page. The headline change in v1.2.0 is that Pulsar monitors are finally fully manageable. Every monitor now has a ⋮ menu with:
- Edit — change the monitor’s request, schedule, or assertions.
- Pause / Enable — stop a monitor from running, or switch it back on, without deleting it.
- Delete — remove a monitor entirely. Deleting always asks for confirmation, and the monitor’s run history is cleared along with it, so you don’t end up with orphaned data.
New monitors are now created with the name “New Pulsar,” and the response-time chart labels its time axis, so you can read when a latency spike happened at a glance.
Why does management matter? Because a single monitor is a toy; a fleet of them is a tool. Once you’re running monitors for login, checkout, search, and webhooks, you need to pause the noisy one during a planned deploy, edit the assertion on another, and retire the one for a deprecated endpoint — all without nuking the whole set. v1.2.0 makes Pulsar something you can actually operate day to day.
If you’ve been catching schema changes by hand, this pairs naturally with contract testing: let a Pulsar monitor run the request on a schedule, and let your assertions fail loudly the moment a response drifts.
Problem 4: Secrets Leak Into Traffic and Nobody Notices
This is the quiet one — the problem that doesn’t break a test but does fail a security review. A JWT ends up in a query string. A bearer token gets logged in a request body. A password-like value travels in plain text. Everything returns 200 OK, so nothing looks wrong, and the leak ships.
The solution: the Beacon capturing proxy and its dashboard. Beacon is a live HTTP proxy built into Orbittest Client. Turn it on and it captures — and decrypts — your traffic, so you can watch every request the system makes, not just the ones you typed into the request builder. There are two views:
- Traffic — a live, filterable stream of every request and response, with method, host, path, status, timing, and size.
- Dashboard — session-level metrics: request count, throughput, error rate, p50/p95/p99 latency, Apdex score, and total data transferred.
The part that makes Beacon more than a network sniffer is its exposed-secret detection. Beacon scans payloads and headers for JWTs, bearer tokens in requests, and password-like values, then lists exactly which requests contained findings and how many. Instead of hoping someone notices a token in a log, Orbittest Client puts a count on the dashboard and points you at the offending request.
For QA and security teams, that’s a genuinely new capability in an API testing tool: you can audit a whole session of real traffic for leaked credentials in seconds. If you want the background on what these tokens are and why they’re sensitive, our guide on API authentication with OAuth and JWT is a good companion read.
Problem 5: Your Test Collections Aren’t Version-Controlled
Test collections drift. Someone edits a request, someone else changes an environment variable, and three weeks later nobody can say what the “real” version is or who changed the auth header. Most API testing tools treat your collections as a private blob in a local database.
The solution: Source Control. Orbittest Client lets you commit your collections and environments straight to a GitHub repository from inside the app. You stage changes, write a commit message, and Commit & Push — with a full history and per-file diffs, exactly like code. That means your API tests get the same review, rollback, and blame that the rest of your codebase enjoys. (Source Control shipped after v1.0.1 and is bundled into the v1.2.0 installer, so upgraders get it for free.)
Smaller Refinements That Add Up
Not every improvement in Orbittest Client v1.2.0 is a headline feature. A few quality-of-life changes make the whole app feel better:
- A cleaner, icon-only activity bar. The left rail no longer shows text labels — hover any icon to see its name. The workspace feels calmer and gives your requests more room.
- Date/time axes on every chart. Time-series charts in Pulsar, Beacon, and the new Performance monitor now label the time axis, so “when did this happen?” is answerable at a glance.
- Fixed: chart tooltips no longer clip at the edges of a graph — they stay fully visible near the borders.
- Import / Export moved off the activity bar. The same tools still live in the Collections
+menu, the Tools grid, and Settings → Data, so there’s one less icon competing for attention.
A Day in the Life with Orbittest Client v1.2.0
Here’s how these features chain together in practice. You start the morning by opening Orbittest Client and glancing at the Performance monitor’s Network view — Cloudflare is rated Excellent, so your connection is healthy and any slowness today is the API’s, not yours. You flip Pulsar’s overnight monitors back on after last night’s deploy, edit one assertion that changed with the new release, and pause the monitor for an endpoint you’re deprecating.
Mid-morning, a teammate reports that login “feels slow.” You enable Beacon, reproduce the flow, and the Dashboard shows p95 latency creeping past your threshold — plus a flag that a bearer token is showing up in a request it shouldn’t. You file two tickets with screenshots instead of hunches. Before lunch, you commit the updated collection through Source Control so the assertion change is reviewed and recorded.
None of that involved a separate monitoring platform, a packet sniffer, or a spreadsheet. It all happened inside one API testing tool.
Best Practices
- Keep the Performance monitor open during long runs. When a data-driven run misbehaves, the CPU and Memory charts tell you in seconds whether it’s the app, your machine, or the API.
- Pick a stable Network target you trust. Use a known-good host (a CDN edge like Cloudflare) as your latency baseline so a Poor rating clearly means your network, not the target.
- Run Pulsar monitors for your critical paths, not everything. Login, checkout, search, webhooks — the flows that hurt most when they break. A focused fleet is easier to operate than a noisy one.
- Treat Beacon findings as build-blockers. If Beacon flags a JWT or bearer token in traffic that shouldn’t carry one, fix it before release — a
200 OKwith a leaked secret is still a failure. - Commit collection changes through Source Control. Review API tests like code so an accidental auth-header edit gets caught in a diff, not in production.
Common Mistakes
- Reading TCP latency as raw
ping. The Network view completes a connection handshake, so its numbers run a touch higher than OSping. Compare trends, not absolute values againstping. - Expecting bandwidth graphs. The Network view measures latency, not throughput. If you need MB/s, that’s outside its scope by design.
- Leaving every Pulsar monitor running through a deploy. Planned downtime will trip your alerts and train you to ignore them. Pause monitors for the services you’re deploying.
- Assuming the request builder shows all traffic. It only shows what you sent. To audit everything an integration actually does, use Beacon.
- Treating exposed-secret flags as noise. Each finding is a real credential in real traffic. Investigate it; don’t dismiss it.
Frequently Asked Questions
What is the Performance monitor in Orbittest Client?
It’s a live, read-only diagnostics dashboard inside Orbittest Client that updates once a second, with four views: CPU, Memory, Network latency, and Processes. It reads only your own machine and the app’s own usage — nothing is uploaded.
How does Orbittest Client measure network latency?
The Network view uses a TCP connection test — a privilege-free stand-in for ICMP ping. It reports Average, Best, and Worst round-trip times, a plain-English rating (Excellent / Good / Fair / Poor / Offline), and the percentage of dropped checks. Because it completes a full handshake, values run slightly higher than a raw OS ping.
What’s the difference between Pulsar and Beacon?
Pulsar runs your saved requests on a schedule to track uptime, error rate, and latency over time — it’s proactive monitoring. Beacon is a live capturing proxy that records and decrypts the traffic flowing through it right now, with session metrics and exposed-secret detection — it’s reactive observation. Both ship in Orbittest Client v1.2.0.
Can Orbittest Client detect secrets like JWTs in API traffic?
Yes. The Beacon dashboard scans captured traffic for JWTs, bearer tokens in requests, and password-like values, then lists exactly which requests contained findings. It’s designed to catch credential leaks during testing, before they reach production.
Do I need to pay for these features?
No. The Performance monitor, Pulsar scheduled monitors, and the Beacon capturing proxy are part of the free Orbittest Client download. Beacon’s capturing is time-boxed on the Free tier and unlimited on Pro; see the feature overview for the full Free vs Pro breakdown.
How do I update to Orbittest Client v1.2.0?
If you already have it installed, you don’t — Orbittest Client checks GitHub Releases and installs new versions in the background automatically. New users can download the signed Windows installer from the releases page.
Conclusion
The first generation of API testing tools answered one question well: what does this endpoint return? That’s necessary, but it was never sufficient. The problems that actually cost teams time and trust live in the spaces between requests — in latency that drifts, services that fail when nobody’s watching, and secrets that slip into traffic unseen.
Orbittest Client v1.2.0 is a deliberate step into that space. The Performance monitor gives you eyes on the machine, the Network view settles the “API or connection?” argument, Pulsar watches your endpoints around the clock, and Beacon turns raw traffic into metrics and security findings. Put together, they move Orbittest Client from a tool you use when testing to a tool you keep open while building.
If part of your week goes to debugging slow APIs, chasing intermittent failures, or proving where a problem lives, the new release is worth the (automatic) upgrade. Read the full v1.2.0 release notes, or download Orbittest Client and open the Performance monitor on your own machine.
Written by Abhay Kumar — QA engineer and creator of OrbitTest, building practical tools for browser, mobile, and API testing. Browse more API testing articles.